IBI Group Inc. Announces Q2 2022 Results, Highlighted by 9.6% Organic Growth, 15.6% Adjusted EBITDA Margin and 17.5 Months of Backlog
Date
August 4, 2022


Download PDF
- 6% Organic growth in Q2 and 10.0% organic growth in first half of 2022
- 12% Net revenue increase in Q2 and 11% increase in first half of 2022
- 17.5 Months of backlog representing $685 million of committed work
Toronto, Ontario – August 4, 2022 – IBI Group Inc. (“IBI” or the “Company”), a globally integrated design and technology firm, today announced its financial and operating results for the three and six months ended June 30, 2022. Select financial and operational information is outlined below and should be read with IBI’s consolidated financial statements (“Financial Statements”) and management’s discussion and analysis (“MD&A”) as of June 30, 2022, which are available on SEDAR at www.sedar.com and on IBI’s website at www.ibigroup.com. Unless otherwise indicated, all references to Adjusted EBITDA in this release means Adjusted EBITDA net of IFRS 16 impacts.
Select Second Quarter 2022 Highlights:
- Net revenue increased 12% to $126.3 million in Q2 2022 over the same period in 2021, with organic growth of 9.6% or $10.8 million, while first half 2022 net revenue totaled $247.1 million, 11% higher than 2021.
- Adjusted EBITDA1 totaled $19.8 million (or 15.6% of net revenue) in Q2 2022 and was $38.6 million (or 15.6% of net revenue) in the first half of 2022, reflecting increases of 10% and 12% over the same periods in 2021, respectively.
- Net income totaled $9.2 million in Q2 2022 and $17.1 million for the first half of 2022, reflecting increases of 10% and 36%, respectively, over the same periods in 2021. Diluted earnings per share totaled $0.24 in the second quarter and were $0.44 in the first half of 2022, growing 10% and 34% over the same respective periods in 2021.
- Net debt to Adjusted EBITDA1,2 multiple was 0.8 times at the end of the quarter, slightly higher than Q1 2022 as net debt increased due to the cash costs of funding acquisitions completed in the quarter along with the share buyback program.
- Backlog increased by 13% to $685 million (17.5 months) relative to Q2 2021 and was 4% ahead of Q1 2022.
- Intelligence net revenue totaled $21.4 million and $42.4 million for Q2 2022 and the six months ended June 30, 2022, respectively, while recurring software support and maintenance billing to clients totaled $5.9 million in Q2 2022, and $11.9 million for the six months ended June 30, an increase of 16% and 15% over the same respective periods in 2021.
- Days sales outstanding (“DSO”) at quarter end totaled 57 days, one day lower than Q2 2021, and the same as Q1 2022.
- During the quarter, IBI closed the acquisition of HotSpot, a complementary and integrated mobility solution focused on providing products for parking, transit, taxi and merchant payments that can offer savings to clients and consumers.
- On July 18, the Company announced an agreement for Netherlands-based Arcadis to acquire all issued and outstanding shares of IBI Group for $19.50 per share in cash, a 40% premium to the Company’s 30-day volume weighted average price. IBI’s Board of Directors and single largest shareholder (the IBI Group Management Partnership) unanimously support the transaction.
Financial Highlights
(in thousands of Canadian dollars except per share amounts or where otherwise indicated)
| THREE MONTHS ENDED JUNE 30 |
THREE MONTHS ENDED MARCH 31 |
SIX MONTHS ENDED JUNE 30 |
|||||||||
| 2022 | 2021 | % Change |
2022 | % Change |
2022 | 2021 | % Change |
||||
| Number of working days | 62 | 62 | 62 | 124 | 125 | ||||||
| Gross revenue | $161,311 | $141,356 | 14% | 140,454 | 15% | $301,765 | $274,288 | 10% | |||
| Less: Subconsultants and direct costs | $34,981 | $28,147 | 24% | 19,698 | 78% | $54,679 | $52,177 | 5% | |||
| Net revenue | $126,330 | $113,209 | 12% | $120,756 | 5% | $247,086 | $222,111 | 11% | |||
| Net income | $9,165 | $8,301 | 10% | $7,966 | 15% | $17,131 | $12,598 | 36% | |||
| Basic earnings per share | $0.24 | $0.22 | 9% | $0.21 | 14% | $0.46 | $0.34 | 35% | |||
| Diluted earnings per share | $0.24 | $0.22 | 9% | $0.21 | 14% | $0.44 | $0.33 | 33% | |||
| Cash flows provided by operating activities | $9,539 | $14,873 | (36%) | ($262) | – | $9,277 | $26,881 | (65%) | |||
| Recurring billings1 | $5,914 | $5,100 | 16% | $6,020 | (2%) | $11,934 | $10,400 | 15% | |||
| Days Sales Outstanding1 | 57 | 58 | (2%) | 57 | – | 57 | 58 | (2%) | |||
| Backlog ($ millions) | $685 | $604 | 13% | $661 | 4% | $685 | $604 | 13% | |||
| Backlog (months) | 17.5 | 17 | 3% | 17 | 3% | 17.5 | 17 | 3% | |||
| Net Debt1 | $47,260 | $44,154 | 7% | $30,968 | 53% | $47,260 | $44,154 | 7% | |||
| Net Debt1 / Adj. EBITDA1,2 ratio | 0.8x | 0.9x | (11%) | 0.6x | 33% | 0.8x | 0.9x | (11%) | |||
| Net Revenue | |||||||||||
| Intelligence | $21,404 | $19,198 | 11% | 20,969 | 2% | $42,372 | $39,089 | 8% | |||
| Buildings | $64,847 | $56,521 | 15% | 61,957 | 5% | $126,806 | $109,814 | 15% | |||
| Infrastructure | $39,605 | $37,199 | 6% | 37,365 | 6% | $76,970 | $72,442 | 6% | |||
| Corporate | $474 | $291 | 63% | 465 | 2% | $938 | $766 | 22% | |||
| Total | $126,330 | $113,209 | 12% | 120,756 | 5% | $247,086 | $222,111 | 11% | |||
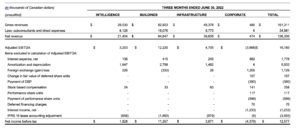
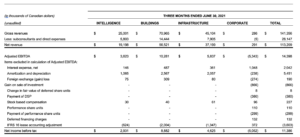
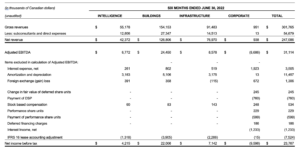
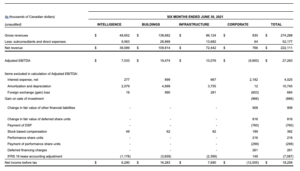
| Adjusted EBITDA1 net of IFRS 16 impacts | |||||||||||
| Intelligence | $3,861 | $4,247 | (9%) | 4,232 | (9%) | $8,090 | $8,711 | (7%) | |||
| Buildings | $14,170 | $12,285 | 15% | 14,187 | – | $28,355 | $23,133 | 23% | |||
| Infrastructure | $5,684 | $7,184 | (21%) | 5,179 | 10% | $10,864 | $12,475 | (13%) | |||
| Corporate | $(3,962) | ($5,715) | (31%) | (4,713) | (16%) | $(8,671) | $(9,949) | (13%) | |||
| Total | $19,753 | $18,001 | 10% | 18,885 | 5% | $38,638 | $34,370 | 12% | |||
| Adjusted EBITDA1 net of IFRS 16 impacts as a % of net revenue | |||||||||||
| Intelligence | 18.0% | 22.1% | (19%) | 20.2% | (11%) | 19.1% | 22.3% | (14%) | |||
| Buildings | 21.9% | 21.7% | 1% | 22.9% | (4%) | 22.4% | 21.1% | 6% | |||
| Infrastructure | 14.4% | 19.3% | (25%) | 13.9% | 4% | 14.1% | 17.2% | (18%) | |||
| Corporate | – | – | – | – | – | – | – | – | |||
| Total | 15.6% | 15.9% | (2%) | 15.6% | – | 15.6% | 15.5% | 1% | |||
Notes:
1 Recurring billings, net debt, net debt to Adjusted EBITDA ratio, and Adjusted EBITDA are non-IFRS measures. Refer to the “Non-IFRS Measures” section of this press release and “Definition of Non-IFRS Measures” in the MD&A for more information on each measure and a reconciliation of Adjusted EBITDA to Net Income. Since these measures are not standard measures under IFRS, they may not be comparable to similar measures reported by other entities.
2 Adjusted EBITDA for bank covenant purposes.
Continued Strong Performance Through First Half of 2022
During the second quarter and first half of 2022, IBI continued to generate positive growth despite an uncertain environment of inflation and recessionary fears. At the Company’s AGM in May, IBI shared a high-level overview of its new, five-year strategic plan, which included targets such as the Company growing to a billion-dollar valuation by 2026, expanding net revenue to $940 million, doubling annual recurring revenue to over $40 million while maintaining a healthy debt leverage ratio of approximately 1.0x. As demonstrated by IBI’s performance during the second quarter, particularly its very strong and growing backlog, the Company was well on the way to advancing these ultimate goals.
With rising interest rates serving as a headwind for the broader economy to date in 2022, there has been a significant increase in purpose-built rental projects in response to growing demand for rental housing across Canada. In Ontario, new building and development fees are set to be levied in 2023, driving developers to accelerate the acquisition of permits and secure grandfathered rates prior to costs increasing. IBI’s resilient business model has benefited from this rush for permits that has fueled the backlog, and has not experienced a meaningful negative impact due to these economic concerns.
In Q2, IBI continued to take on and schedule more work – particularly in the Buildings sector – resulting in a backlog that is growing at a rapid pace despite work continuing to be completed. IBI’s backlog increased to $685 million at the end of June, 2022, which represents 17.5 months, 13% higher than the same period last year and 4% higher than the previous quarter. The Company’s ability to execute remained intact, as even within the current tight labour market and a significant demand for workers, IBI continued to be successful finding and hiring talent at affordable levels.
IBI’s corporate net revenue in Q2 2022 increased by 12% over Q2 2021, totaling $126.3 million, and was $247.1 million in the first six months of the year. Further, the Company successfully generated 9.6% organic growth in Q2 2022 and 10.0% in the first half of 2022 driven largely by the ongoing strength in the Buildings sector. IBI’s Adjusted EBITDA1 was $19.8 million, or 15.6% of net revenue, 10% higher than Q2 2021 and in the first six months of the year was $38.6 million, or 12% above the same period the previous year. Net income grew to $9.2 million ($0.24 per diluted share) in the quarter and was $17.1 million ($0.44 per diluted share) in the first six months of the year.
“I am extremely proud of what IBI has accomplished to date in 2022, as our growing backlog and 9.6% organic growth clearly demonstrates the benefits of our integrated Intelligence, Buildings and Infrastructure sectors, along with a healthy balance sheet and net debt to Adjusted EBITDA2 multiple of 0.8 times at the end of the quarter,” said Scott Stewart, Chief Executive Officer of IBI Group. “It is due to this ongoing strong performance, coupled with our digital leadership, that Arcadis recognized IBI as a key opportunity to fulfill the goal of becoming a global leader in planning, designing and building resilient cities of tomorrow. We are pleased to recommend that shareholders vote in favour of IBI’s acquisition by Arcadis, which will position the combined entity with world class software and systems design, systems integration, digital client solutions and innovation capabilities.”
At quarter end, IBI had net debt of $47.3 million, 7% higher than the same period in 2021, resulting in a net debt1 to Adjusted EBITDA1 multiple of 0.8 times compared to 0.9 times in Q2 2021. The modest increase in net debt is due primarily to an increase in credit facility draws and bank indebtedness associated with funding the cash portion of acquisitions. It is common for IBI to require and utilize more cash within the first half of the year, typically offset by the Company being a net generator of cash in the second half.
Business Sector Summary Highlights
Intelligence
Net revenue from IBI’s Intelligence sector totaled $21.4 million in Q2 2022, 11% growth relative to the same period in 2021, and was $42.4 million in the first half of the year, 8% higher than the same period in 2021. Recurring billings also grew to $5.9 million in Q2 and were $11.9 million for the first six months of 2022, 16% and 15% higher than the same respective periods in 2021. Intelligence Adjusted EBITDA1 and the associated margins were lower in the three and six month periods ended June 30, related to timing delays on revenue recognition for certain Intelligence projects, which are expected to be reversed through the last half of the year. In the second quarter and first half of 2022, Intelligence Adjusted EBITDA1 totaled $3.9 million, or 18.0% of net revenue and $8.1 million, or 19.1% of net revenue, respectively.
On May 31, 2022, the Company acquired HotSpot for $5.7 million, with $2.8 million paid in cash on closing with the balance to be paid through a three-year deferred payment along with $1.5 million in deferred consideration for retention of certain key employees. Through this acquisition, IBI’s mobility solutions in the urban space will benefit from payment capabilities, which also complement the Company’s CurbIQ product. Both solutions offer a comprehensive set of tools for the parking and curbside management needs of any city and serve to enhance the Company’s existing traveler information solutions, deployed in South Africa, North America and the UK.
Buildings
IBI’s Buildings sector remains a standout business segment with extremely strong performance both in Q2 and the first half of 2022. This is being fueled by rising immigration that continues to drive steady demand across Canada’s core urban centres, coupled with the acceleration of developer permitting to avoid higher costs in future years. With continued growth in development along transit corridors, coupled with the intensification or redevelopment of retail centres and industrial markets, the backlog and demand for Buildings work remains robust. Net revenue in Q2 2022 grew to $64.8 million, an increase of 15% over Q2 2021 and 5% higher than in Q1 2022. During the six months ended June 30, 2022, Buildings net revenue totaled $126.8 million, reflecting growth of 15% over the same period the prior year. Adjusted EBITDA1 was similarly strong at $14.2 million or 21.9% of net revenue for the quarter, an increase of 15% over Q2 2021 and was $28.4 million, or 22.4% of net revenue for the first half of the year, 23% higher than the same period in 2021. With the Buildings sector being fully booked for the year, continued healthy performance is anticipated, even in the face of rising interest rates.
Infrastructure
Within the Infrastructure sector, ongoing public transit infrastructure investment contributed to Q2 2022 net revenue of $39.6 million, a 6% increase over both Q2 2021 and the previous quarter, while net revenue in the first six months of 2022 grew 6% to total $77.0 million. The growth in revenue for this sector represents a pipeline of future projects across the country, including further large-scale transit expansion projects. Adjusted EBITDA1 from Infrastructure was $5.7 million or 14.4% of net revenue in Q2 2022, a decrease of 21% relative to Q2 2021 but an increase of 10% over Q1 2022. In the six months ended June 30, 2022, Infrastructure Adjusted EBITDA1 was $10.9 million, or 14.1% of net revenue, representing a decline 13% relative to the same period in 2021.
Subsequent Event
On July 18, 2022, the Company announced they have entered into an agreement for Arcadis, a full service global design, engineering and consultancy firm based in Amsterdam to acquire all issued and outstanding shares of the Company for $19.50 per share. The transaction is unanimously supported by the Board of Directors and IBI Group Management Partnership, which has entered into a voting support agreement to support and vote in favor of the transaction. The transaction is expected to be completed in the second half of 2022. A Special Meeting of shareholders to vote on this transaction is scheduled to be held virtually on September 16, 2022 at 10:00am ET. Additional information regarding the terms of the transaction, the background, rationale for the recommendations made by the special committee and the board of directors, and how IBI shareholders can participate in and vote at the Special Meeting will be provided in the management information circular, which will be filed on SEDAR and mailed to shareholders in the coming weeks along with other related meeting materials.
1 Recurring billings, net debt, net debt to Adjusted EBITDA ratio, and Adjusted EBITDA are non-IFRS measures. Refer to the “Non-IFRS Measures” section of this press release and “Definition of Non-IFRS Measures” in the MD&A for more information on each measure and a reconciliation of Adjusted EBITDA to Net Income. Since these measures are not standard measures under IFRS, they may not be comparable to similar measures reported by other entities.
2 Adjusted EBITDA for bank covenant purposes.
Investor Conference Call & Webcast
The Company will host a conference call on Friday, August 5th, 2022 at 8:30 a.m. ET during which IBI’s Chief Executive Officer, Scott Stewart, and Chief Financial Officer, Stephen Taylor, will discuss the Company’s financial and operating results followed by a question-and-answer session.
To listen to the live webcast of the conference call, please enter the following URL into your web browser: https://produceredition.webcasts.com/starthere.jsp?ei=1557885&tp_key=af6d620ba0.
Q2 2022 Conference Call Details:
Date: Friday, August 5th, 2022
Time: 8:30 a.m. ET
Dial In: North America: 1-888-390-0546
Dial In: Toronto Local / International: 416-764-8688
Replay: North America: 1-888-390-0541
Replay: Toronto Local / International: 416-764-8677
Replay Passcode: 031159#
A recording of the conference call will be available within 24 hours following the call on the Company’s website. The conference call replay will be available until August 19th, 2022.
About IBI Group Inc.
IBI Group Inc. (TSX:IBG) is a technology-driven design firm with global architecture, engineering, planning, and technology expertise spanning over 60 offices and 3,400 professionals around the world. For nearly 50 years, its dedicated professionals have helped clients create livable, sustainable, and advanced urban environments. IBI Group believes that cities thrive when designed with intelligent systems, sustainable buildings, efficient infrastructure, and a human touch. Follow IBI Group on Twitter, LinkedIn and Instagram.
For additional information, please contact:
Stephen Taylor, CFO
IBI Group Inc.
55 St. Clair Avenue West
Toronto, ON M5V 2Y7
Tel: 416-596-1930
www.ibigroup.com
Forward-Looking Statements
Certain statements in this news release may constitute “forward-looking” statements which involve known and unknown risks, uncertainties and other factors which may cause the actual results, performance or achievements of the Company and its subsidiary entities, including IBI Group Partnership (“IBI Group”) or the industry in which they operate, to be materially different from any future results, performance or achievements expressed or implied by such forward looking statements. When used in this news release, such statements use words such as “may”, “will”, “expect”, “believe”, “plan” and other similar terminology. These statements reflect management’s current expectations regarding future events and operating performance and speak only as of the date of this news release. These forward-looking statements involve a number of risks and uncertainties, including those related to: (i) the Company’s ability to maintain profitability and manage its growth; (ii) the Company’s reliance on its key professionals; (iii) competition in the industry in which the Company operates; (iv) timely completion by the Company of projects and performance by the Company of its obligations; (v) fixed-price contracts; (vi) the general state of the economy; (vii) risk of future legal proceedings against the Company; (viii) the international operations of the Company; (ix) reduction in the Company’s backlog; (x) fluctuations in interest rates; (xi) fluctuations in currency exchange rates; (xii) upfront risk of time invested in participating in consortia bidding on large projects and projects being contracted through private finance initiatives; (xiii) limits under the Company’s insurance policies; (xiv) the Company’s reliance on distributions from its subsidiary entities and, as a result, its susceptibility to fluctuations in their performance; (xv) unpredictability and volatility in the price of common shares of the Company; (xvi) the degree to which the Company is leveraged and the effect of the restrictive and financial covenants in the Company’s credit facilities; (xvii) the possibility that the Company may issue additional common shares diluting existing Shareholders’ interests; (xviii) income tax matters. These risk factors are discussed in detail under the heading “Risk Factors” in the Company’s Annual Information Form. New risk factors may arise from time to time and it is not possible for management of the Company to predict all of those risk factors or the extent to which any factor or combination of factors may cause actual results, performance or achievements of the Company to be materially different from those contained in forward-looking statements. Given these risks and uncertainties, investors should not place undue reliance on forward-looking statements as a prediction of actual results. Although the forward-looking statements contained in this news release are based upon what management believes to be reasonable assumptions, the Company cannot assure investors that actual results will be consistent with these forward-looking statements. These forward-looking statements are made as of August 4th, 2022.
The factors used to develop revenue forecast in this news release include the total amount of work the Company has signed an agreement with its clients to complete, the timeline in which that work will be completed based on the current pace of work the Company achieved over the last 12 months and expects to achieve over the next 12 months. The Company updates these assumptions at each reporting period and adjusts its forward-looking information as necessary.
Definition of Non-IFRS Measures
Non-IFRS measures do not have a standardized meaning within IFRS and are therefore unlikely to be comparable to additional measures presented by other issuers. In commentary and tables within this document IFRS measures are presented along with non-IFRS measures. Where non-IFRS measures are used, there is a reconciliation to IFRS amounts provided. Any changes in the definition of non-IFRS are disclosed and quantified.
Adjusted EBITDA1 for Bank Covenant Purposes
The Company believes that Adjusted EBITDA for bank covenant purposes, defined below, is an important measure for investors to understand the Company’s ability to generate cash to honour its obligations. Management of the Company believes that in addition to net income (loss), Adjusted EBITDA for bank covenant purposes is a useful supplemental measure as it provides readers with an indication of cash available for debt service, capital expenditures, income taxes and dividends. Readers should be cautioned, however, that Adjusted EBITDA for bank covenant purposes should not be construed as an alternative to net income (loss) determined in accordance with IFRS as an indicator of the Company’s performance or to cash flows from operating activities as a measure of liquidity and cash flows.
The Company defines Adjusted EBITDA for bank covenant purposes in accordance with what is required in its lending agreements with its senior lenders.
References in this Press Release to Adjusted EBITDA for bank covenant purposes are based on EBITDA adjusted for the following items:
- Gain/loss arising from extraordinary, unusual or non-recurring items, such as debt extinguishments
- Acquisition costs and deferred consideration revenue (i.e. restructuring costs, integration costs, compensation expenses, transaction fees and expenses)
- Non-cash expenses (i.e. grant of stock options, restricted share units or Capital stock to employees as compensation)
- Gain/Loss realized upon the disposal of capital property
- Gain/loss on foreign exchange translation
- Gain/loss on purchase or redemption of securities issued by that person or any subsidiary
- Gain/loss on fair valuation of financial instruments
- Amounts attributable to minority equity investments
- Interest income
Adjusted EBITDA for bank covenant purposes is not a recognized measure under IFRS and does not have a standardized meaning prescribed by IFRS, and the Company’s method of calculating Adjusted EBITDA for bank covenant purposes may differ from the methods used by other similar entities. Accordingly, Adjusted EBITDA for bank covenant purposes may not be comparable to similar measures used by such entities. Reconciliations of net income (loss) to adjusted EBITDA for bank covenant purposes have been provided under the heading “Reconciliation of Non-IFRS measures”.
Net Debt
Net debt is a non-IFRS measure that does not have a standardized meaning under IFRS and therefore may not be comparable to similar measures presented by other issuers. The Company calculates net debt as the balance of the credit facilities, debentures and other financial liabilities less the Company’s unrestricted cash.
Net debt as a multiple of adjusted EBITDA is determined as net debt as defined divided by Adjusted EBITDA (as defined above). There is no directly comparable measures for Net debt as a multiple of Adjusted EBITDA. Net debt as a multiple of Adjusted EBITDA is quantified under the heading “Capital Management”.
Working Capital
Working Capital is a non-IFRS measure that does not have a standardized meaning under IFRS and therefore may not be comparable to similar measures presented by other issuers. The Company use working capital as a measure of assessing overall liquidity and is calculated by subtracting current liabilities from current assets. There is no directly comparable IFRS measure for working capital. Working capital is quantified under the heading “Liquidity and Capital resources”.
Working Capital Measured in Number of Days of Gross Billings
Included in working capital of the Company are amounts reflecting project costs and sub-consultant expenses. The Company only reports its net fee volume as revenue, which would not include the billings for the recovery of these incurred costs. Therefore, to measure number of days outstanding of working capital, the gross billings, which include the billings for recovery of project expenses, would result in more consistent calculations.
The information included is calculated based on working days on a twelve-month trailing basis, measured as days outstanding on gross billings, which is estimated to be approximately 30% greater than net fee volume.
The Company believes that informing investors of its progress in managing its accounts receivable, contract assets and contract liabilities is important for investors to anticipate cash flows from the business and to compare the Company with other businesses that operate in the same industry. There is no directly comparable IFRS measure. Working capital measured in number of Days of Gross Billings is quantified under the heading “Liquidity and Capital resources”.
Billing from Recurring Software Support and Maintenance
The amount of recurring software support and maintenance gross billings represents the annualized invoice amount the Company is able to charge clients and is recognized to revenue in accordance with the Company’s accounting policy through the movement in the accounts receivable and contract assets balances in the statement of financial position. There is no directly comparable IFRS measure.